What is a Dashboard?
A dashboard is an information management tool that gives an overview of a company’s key performance indicators (KPIs). Dashboards monitor the key metrics and health of a company.
Dashboards make it easy to visualize and understand your data. They often measure performance data in tables, charts, and maps.
Dashboards can help answer questions like:
- Are your sales on target?
- Is your spending in line with the marketing budget?
- What is the employee turnover rate?

Types of Dashboards
Marketing dashboards
Marketing dashboards help track all marketing performance metrics. For example, how many qualified leads have been passed to sales? What is the conversion rate? How are paid ads performing?
Marketers use dashboards to measure:
- Marketing and sales funnel activities
- Web analytics
- Paid ad performance
- Content performance
- SEO activities (backlinks, rankings)
- Social media stats

Sales dashboards
Sales teams want to keep a close eye on their pipeline to make sure they are meeting their targets. Sales dashboards help managers track opportunities, bookings or compensation. They display sales KPIs and metrics, which make it easy to spot successes and potential issues.

Executive dashboards
Executive dashboards summarize the most important metrics from all departments. They help executives understand the status of a business and make informed decisions.
What metrics can executive dashboards track?
- Sales results
- Marketing performance
- Human resources stats
- Company finances
- Product and service metrics
Dashboards for SaaS
In competitive SaaS markets, companies want to have better visibility of their KPIs. They want to track MRR (monthly recurring revenue), customer retention, and churn rates.
What can you track with SaaS dashboards?
- Monthly Recurring Revenue (MRR)
- Annualized Run Rate (ARR)
- Customer Lifetime Value (LTV)
- Customer Acquisition Cost (CAC)
- Customer Retention
- Churn Rate
- Average Revenue per Account (ARPA)

Why You Should Use Dashboards
Track the metrics that matter
Dashboards help you stay focused on the metrics that matter to your business. They are the best way to analyze company performance and spot problems that need to be addressed.
Easy to understand at a glance
Dashboards effectively visualize complex data in simple charts, tables, or maps. Data visualizations are crucial for understanding and readability.
Dashboards save time
Dashboards put all the information you need in one place. You can view key metrics without wasting time navigating across different systems, tools, and data sources.
Quickly share data with executives and team members
Dashboards give other people access to important data. Team members can share KPIs with others from desktop and mobile devices. Managers can grant public and private access to view different levels of information.
Spot problems early
The more you know about how your business is performing, the better chance you have to stay on track. Dashboards help spot issues or potential problems early, giving you the opportunity to take a closer look and adjust strategy.
Best Practices for Creating Dashboards
- Keep the design of your dashboard simple. Make it easy to read so viewers will understand the data quickly.
- Compare your performance to previous periods. This helps viewers understand what performance metrics are exceeding expectations and what needs to be improved.
- Don't try to show everything on your dashboard. Highlight the most important KPIs for your department or industry. You don’t want to overload people with too much information.
- Display the most important metrics with larger size numbers. This draws people’s attention to key performance metrics first.
- Design dashboards that are responsive and easy to read on all devices. Make sure people can view dashboards outside of the office from mobile phones or tablets.
- Choose the right charts for your dashboard. Learn more how to pick the right chart here.
- Use color wisely: be consistent, use light or neutral colors for visualizations and add strong colors to attract attention.
WE CAN CREATE DIFFERENT TYPE OF PROJECT IN MICROSOFT EXCEL FILE
- BSE , NSE , FNO LIVE PRICE IN EXCEL FILE
- WEDDING BUDGET PLANNING
- LOAN SCHEDULE YEAR , MONTH WISE INTEREST CALCULATE IN EXCEL FILE
- CALL CENTER RECORD MODULE IN EXCEL FILE
- COURIER RECORD MODULE IN EXCEL FILE
BSE , NSE , FNO LIVE PRICE IN EXCEL FILE
- BSE , NSE , FNO LIVE PRICE IN EXCEL FILE
- WEDDING BUDGET PLANNING
- LOAN SCHEDULE YEAR , MONTH WISE INTEREST CALCULATE IN EXCEL FILE
- CALL CENTER RECORD MODULE IN EXCEL FILE
- COURIER RECORD MODULE IN EXCEL FILE
BSE , NSE , FNO LIVE PRICE IN EXCEL FILE
WE CAN PROVIDE BSE & NSE & FNO LIVE PRICE IN EXCEL FILEEASILY MANAGE YOUR PORTFOLIO CURRENT PROFIT PERCENTAGE & AMOUNTEASILY SORT SCRIP (BSE , NSE , FNO)
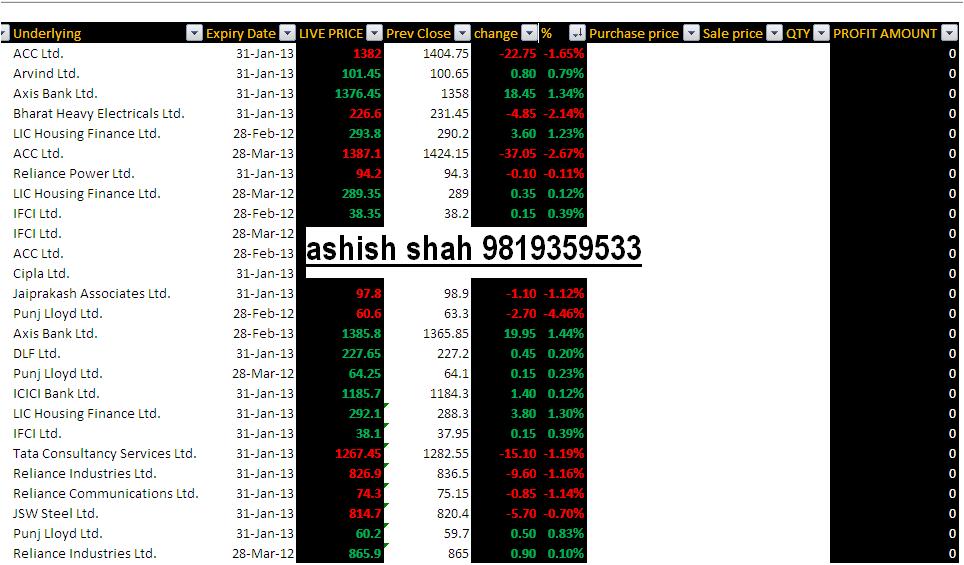

BSE & NSE STOCK LIVE PRICE IN EXCEL FILE SO EASILY YOUR CREAT PORTFOILO